import altair as alt
from vega_datasets import data

boroughs = alt.topo_feature(data.londonBoroughs.url, 'boroughs')
tubelines = alt.topo_feature(data.londonTubeLines.url, 'line')
centroids = data.londonCentroids.url
background = alt.Chart(boroughs, width=700, height=500).mark_geoshape(
stroke='white',
strokeWidth=2
).encode(
color=alt.value('#eee'),
)
labels = alt.Chart(centroids).mark_text().encode(
longitude='cx:Q',
latitude='cy:Q',
text='bLabel:N',
size=alt.value(8),
opacity=alt.value(0.6)
).transform_calculate(
"bLabel", "indexof (datum.name,' ') > 0 ? substring(datum.name,0,indexof(datum.name, ' ')) : datum.name"
)
line_scale = alt.Scale(domain=["Bakerloo", "Central", "Circle", "District", "DLR",
"Hammersmith & City", "Jubilee", "Metropolitan", "Northern",
"Piccadilly", "Victoria", "Waterloo & City"],
range=["rgb(137,78,36)", "rgb(220,36,30)", "rgb(255,206,0)",
"rgb(1,114,41)", "rgb(0,175,173)", "rgb(215,153,175)",
"rgb(106,114,120)", "rgb(114,17,84)", "rgb(0,0,0)",
"rgb(0,24,168)", "rgb(0,160,226)", "rgb(106,187,170)"])
lines = alt.Chart(tubelines).mark_geoshape(
filled=False,
strokeWidth=2
).encode(
alt.Color('id:N')
.title(None)
.legend(orient='bottom-right', offset=0)
.scale(line_scale)
)
background + labels + linesimport altair as alt
from vega_datasets import data
import geopandas as gpd
url = "https://naciscdn.org/naturalearth/110m/cultural/ne_110m_admin_0_countries.zip"
gdf_ne = gpd.read_file(url) # zipped shapefile
gdf_ne = gdf_ne[["NAME", "CONTINENT", "POP_EST", 'geometry']]
alt.Chart(gdf_ne).mark_geoshape(
fill='lightgrey',stroke='white',strokeWidth=0.5
)Geo Pandas
import geopandas
from geodatasets import get_path

path_to_data = get_path("nybb")
gdf = geopandas.read_file(path_to_data)
import matplotlib.pyplot as plt
%config InlineBackend.figure_format='retina'
ax=plt.gca()
gdf.plot(ax=ax)
gdf.centroid.plot(ax=ax,color='white')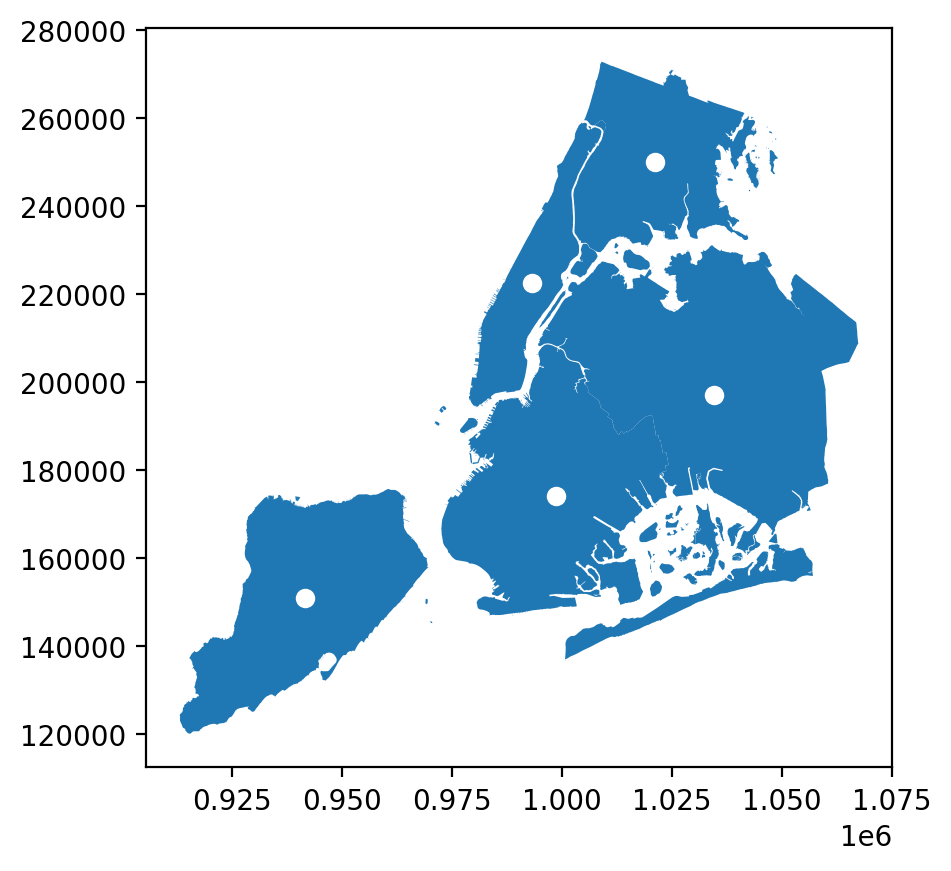
gdf.explore()Make this Notebook Trusted to load map: File -> Trust Notebook