library(tidyverse)
library(sf)
library(leaflet)
.label_data_src = "data source: NUFORC data by Sigmond Axel (2014)"
## read data and clean date
ufo <- read_csv('./scrubbed.csv') |>
janitor::clean_names() |>
mutate(
datetime = as_datetime(datetime, format = "%m/%e/%Y %R")
,date_posted = as_date(date_posted, format="%m/%e/%Y")) |>
mutate(id = row_number()) |>
relocate(id)
## convert to sf object
ufo_points = ufo |>
filter(!is.na(latitude) & !is.na(longitude)) |>
filter(!(latitude == 0 & longitude == 0)) |>
drop_na() |>
sf::st_as_sf(coords=c("longitude","latitude"),crs=4326)
# df_scr <- read_csv('./scrubbed.csv') |> janitor::clean_names()
## Below used to analysis how to format date
# ## analysis to check which one is digit which one is date, which one is month
# df_com |>
# select(datetime) |>
# mutate(
# md1 = str_extract(datetime, "^\\d{1,2}")
# ,md2 = str_extract(datetime, "(?<=[\\d]{2}\\/)\\d{1,2}")
# ) |>
# distinct(md1,md2)
# ## first digit is month, second is date
# stopifnot(0!=df_com |>
# select(datetime) |>
# mutate(datetime_ = as_datetime(datetime, format="%m/%e/%Y %R")) |>
# filter(day(datetime_) > 12) |>
# nrow())
# ## the format you want to extract is "%m/%e/%Y %R" use lubridate dattiemIntroduction
I first encounter UFO for my master degree. Not literally. I need a project for my “Data Viz” module. But back then my geo-spatial analysis skills was limited.
This little project will look over these data an attempt to answer questions such as:
- Where can I find aliens?
- What does a UFO typically looks like (based on description)?
- Has alien left us since the 1980s? (temporal patterns)
The Data
Data includes both logitude location and times. So can do both time series or spatial viz. Source: https://www.kaggle.com/NUFORC/ufo-sightings
The complete data includes entries where the location of the sighting was not found or blank (0.8146%) or have an erroneous or blank time (8.0237%). Since the reports date back to the 20th century, some older data might be obscured. Data contains city, state, time, description, and duration of each sighting.
Exploratory Analysis
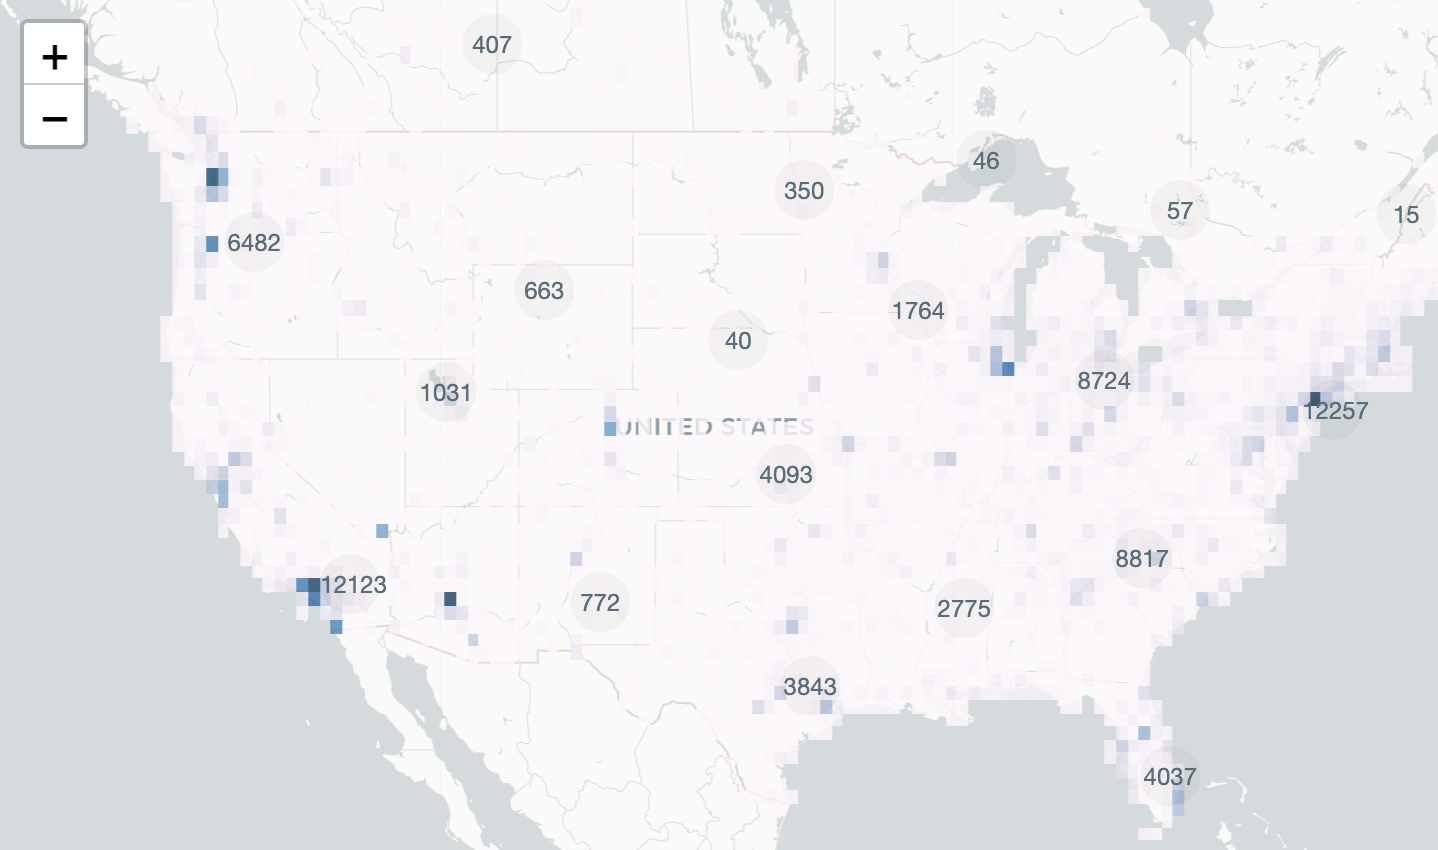
Grand Map View
Here is an interactive visualisation for all the code
[1] "The propotion of data visualised is: 0.83"[1] "1910-01-02 UTC" "2014-05-08 UTC"create UFO icon map - make icon
## over all scale using
ufo_icon = makeIcon(iconUrl = "./asset/ufo.png",
iconWidth = 25, iconHeight = 25)
## a javascript function which creates clusters
clus_func_js = function() {
JS("
function(cluster) {
return new L.DivIcon({
html: '<div style=\"background-color:rgba(77,77,77,0.05)\"><span>' + cluster.getChildCount() + '</div><span>',
className: 'marker-cluster'
});
}")
}
## crystallize above code into a function
addUFOMarker = function(x) {
addMarkers(
x,
## automatically add sf object
icon = ufo_icon,
clusterOptions = markerClusterOptions(
iconCreateFunction = clus_func_js()
),
## sorry! depends on having below columns
label = ~ label,
popup = ~comments_,
group = "ufo"
)
}
## Make UFO Icon ---------------------------------------------------------------
## access polygon data
country_polygons = spData::world |>
filter(iso_a2 %in% c("GB","US","CA"))
## make grid on top of the layer
mesh=sf::st_make_grid(
country_polygons
,cellsize = c(0.5,0.5)
,square = T
)
## intersect points
ids = st_intersects(mesh,ufo_points)
which_non_zeros = which(lengths(ids) != 0)
pixels =st_as_sf(x=mesh[which_non_zeros])
pixels$n = lengths(ids)[which_non_zeros]
## Make the Map ----------------------------------------------------------------
## leaflet color palete
pal <- colorNumeric(
palette = "PuBu",
domain = sqrt(pixels$n))
## use base layer of map
## set view to USA
us_lon <- -95.71 #W
us_lat <- 37.09 #N
base_map = ufo_points |>
mutate(
label = paste(city,state,country,shape)
,comments_ = paste0(datetime,": ", comments)
) |>
leaflet() |>
setView(lng = us_lon, lat = us_lat, zoom =4) |>
addProviderTiles(providers$CartoDB.Positron)
## the grand map himself
base_map |>
addPolygons(
data=pixels,stroke=F,fillColor = ~pal(sqrt(pixels$n))
, fillOpacity = 0.8
, group = "heatmap") |>
addUFOMarker() |> ## leaflet color palete
addLayersControl(
overlayGroups=c("ufo","heatmap")
)