Introduction
In this part we explore 3D map with ESRI JS SDK.
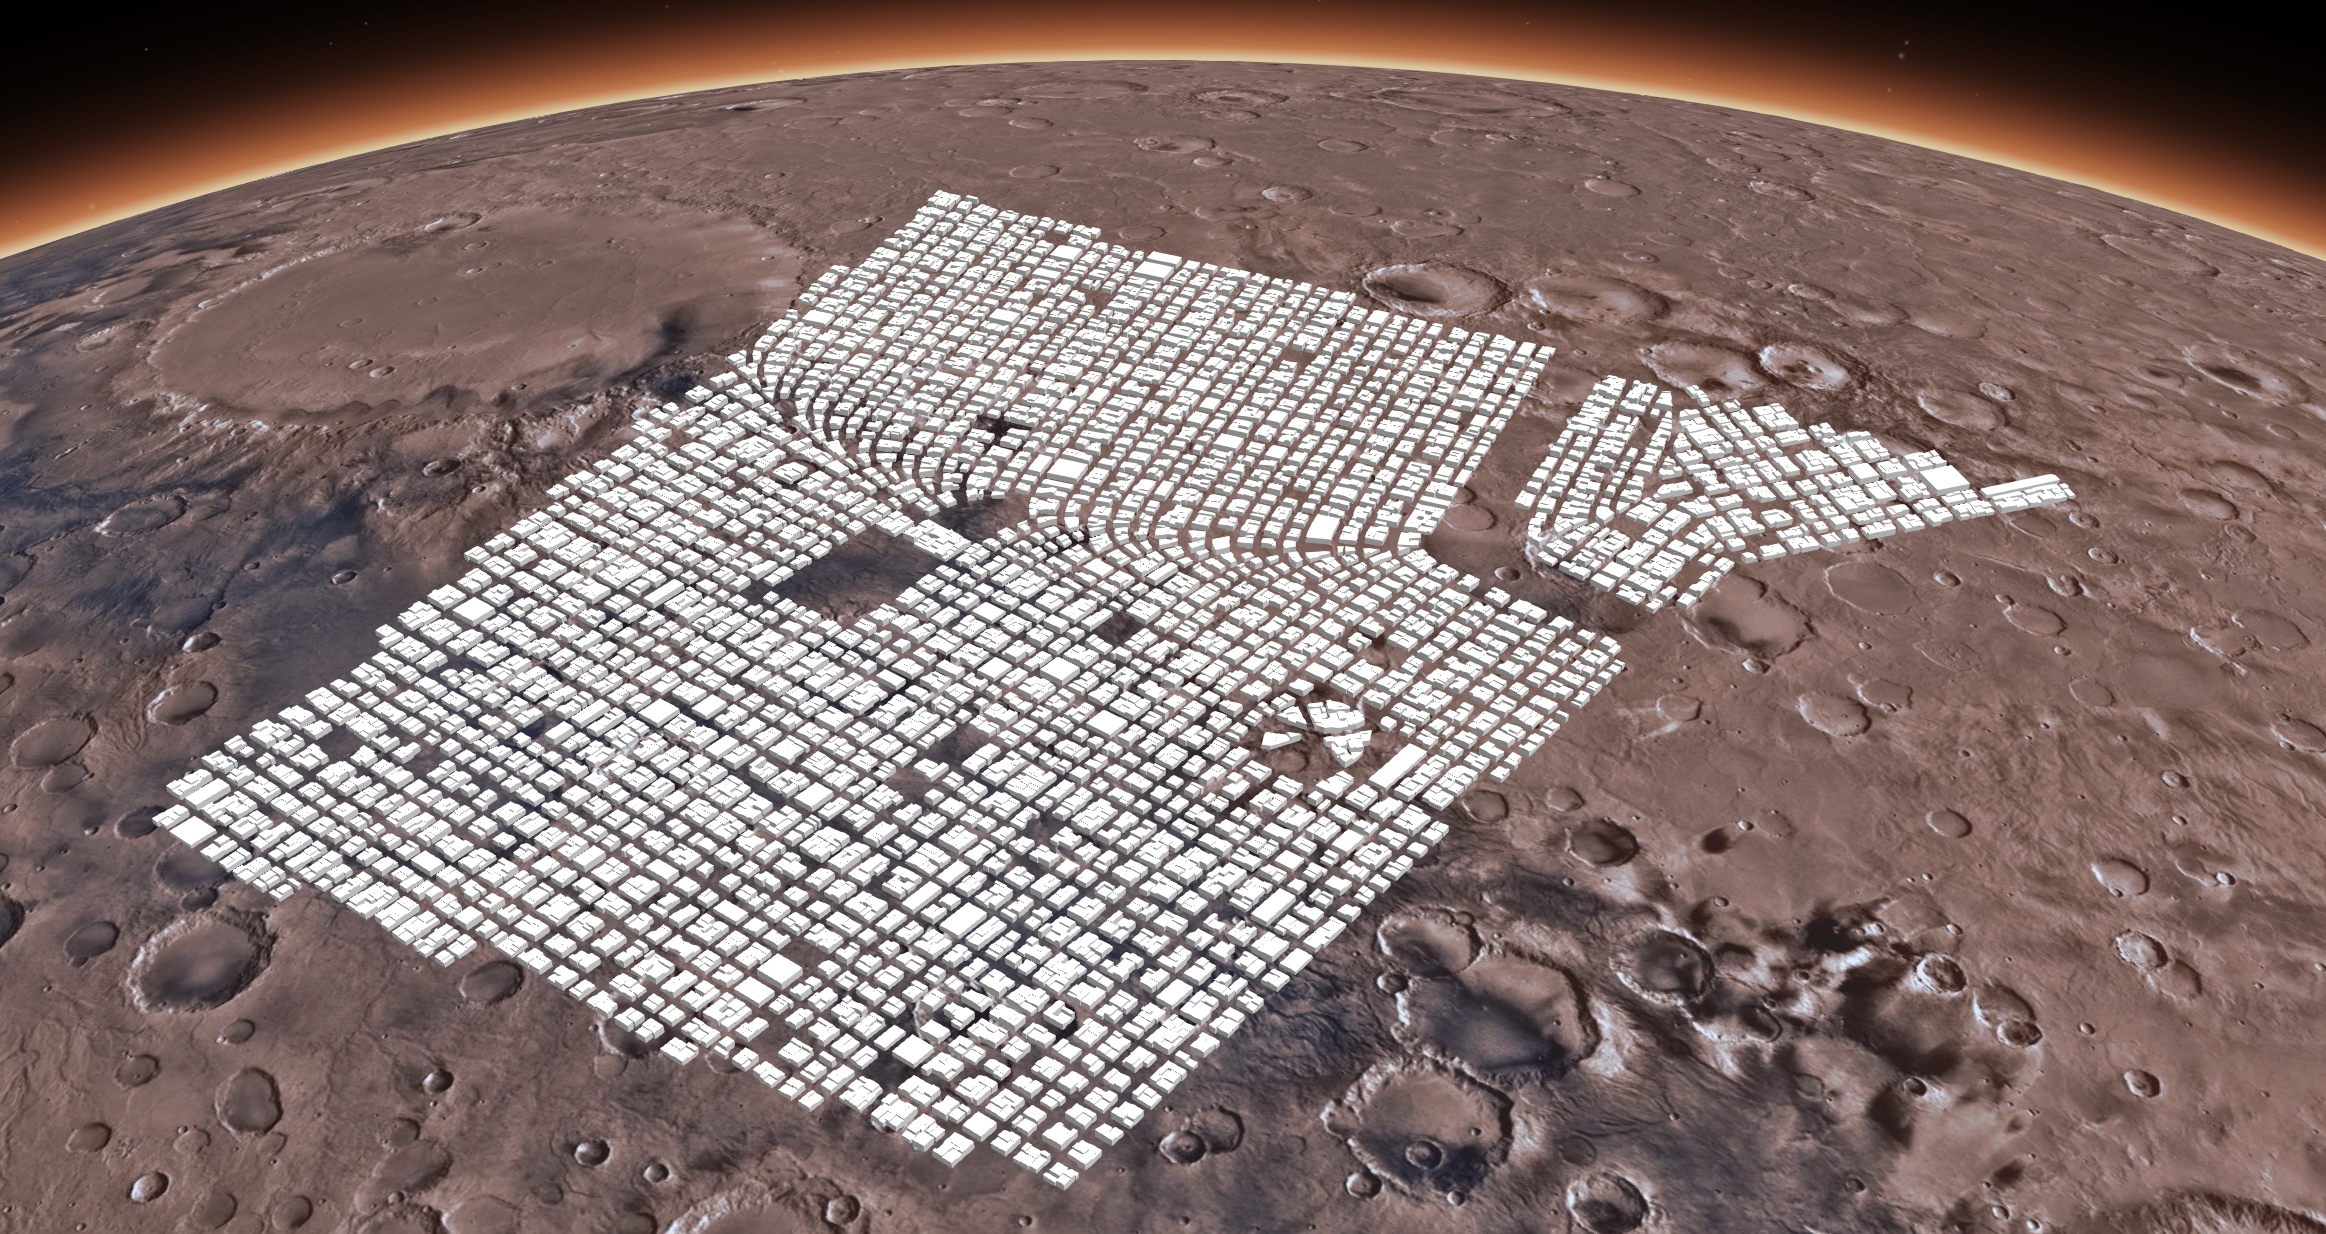
For the final product we do something very simple, reuse the 3D model building we have created in Part I and simpley pin it to ERSI mars layer as a “single point”.
This will be an introduction before we do more cool stuff with ESRI!
Working with ESRI Javascript SDK - Using CDN
CDN stands for Content Delievery Network; Typically there are two work-flows with ESRI api:
- Set a Map with Layers;
- Set a SceneView (SceneView for 3D stuff just View for 2D)
requireis javascript;
To make ESRI SDK avaible you need add these two script tag:
<script src="https://js.arcgis.com/4.30/"></script>
<script>
    // Your API key should be defined before loading the ArcGIS JavaScript API
    const apiKey = "YOUR_API_KEY_HERE";
</script>
To make this style a little better add these stylesheet;
<link rel="stylesheet" href="https://js.arcgis.com/4.32/esri/themes/light/main.css">

<style>
    html,
    body,
    #viewDiv {
        padding: 0;
        margin: 0;
        height: 100%;
        width: 100%;
    }
</style>
Example: Create a 3D elevation map
This script became avaiable once we have a
- map
- view
require([
        "esri/config",
        "esri/Map",
        "esri/views/SceneView"
        ], function(esriConfig, Map, SceneView) {
            esriConfig.apiKey = apiKey
            const map = new Map({
                basemap: "arcgis/topographic", // basemap styles service
                ground: "world-elevation", //Elevation service
            });
            const view = new SceneView({
                container: "viewDiv",
                map: map,
                camera: {
                    position: {
                    x: -118.808, //Longitude
                    y: 33.961, //Latitude
                    z: 2000 //Meters
                    },
                    tilt: 75
                }
            });
        });
Add a Mars Map
Arg GIS provide a basic example of mars elevation map. Fun fact, Mars SRID is “wkid: 104971”, useful for April Fools day ‘o͡͡͡͡͡͡͡͡͡͡͡͡͡͡╮(。❛ᴗ❛。)╭o͡͡͡͡͡͡͡͡͡͡͡͡͡͡’
This is what they call a “global scene view”:
Global and local scenes are different viewing modes you can use to visualize 3D data. When you work with a scene, you choose whether to render the data on a globe or to project it on a plane that can be navigated in 3D space.
A global scene is typically used to display data that spans around the globe when viewing the curvature of the earth is important.
Map:- groud: {layers:
ElevationLayer} - layers:
TileLayer
- groud: {layers:
ScenView
require([
  "esri/Map",
  "esri/views/SceneView",
  "esri/layers/ElevationLayer",
  "esri/layers/TileLayer",
  "esri/layers/FeatureLayer",
  "esri/widgets/LayerList"
], (Map, SceneView, ElevationLayer, TileLayer, FeatureLayer, LayerList) => {
    // map is consist of Mars Elevation map and
    // image layers (amost like material)
    const map = new Map({
        ground: {
            layers: [marsElevation]
        },
        layers: [marsImagery]
    });

    // mars elevation is given by arcgis
    const marsElevation = new ElevationLayer({
        url: "https://astro.arcgis.com/arcgis/rest/services/OnMars/MDEM200M/ImageServer",
        copyright: "NASA, ESA, HRSC, Goddard Space Flight Center, USGS Astrogeology Science Center, Esri"
    });

    // mars image is also given but you need create an object
    const marsImagery = new TileLayer({
        url: "https://astro.arcgis.com/arcgis/rest/services/OnMars/MDIM/MapServer",
        title: "Imagery",
        copyright: "USGS Astrogeology Science Center, NASA, JPL, Esri"
    });

    const view = new SceneView({
        map: map,
        container: "viewDiv",
        // setting the spatial reference for Mars_2000 coordinate system
        spatialReference: {
            wkid: 104971
        },
        camera: {
            position: {
            x: 27.63423,
            y: -6.34466,
            z: 1281525.766,
            spatialReference: 104971
            },
            heading: 332.28,
            tilt: 37.12
        }
    });
})
What about Detailed 3d Models in ESRI?
Here are my research how to do this. ARCGIS seems to gives you three options
- publish a scene service,
- integrated mesh layer and 3D object scene layer
- as footprint (just polygons with height)
Accroding to ESRI, publish a scene service is the orthodoxical way:
Some visualizations can be made more compelling when they display the detailed 3D model of a building. 3D object scene layers store large city models that can be displayed with textures or colors. Such data can be modeled in software such as ArcGIS Pro or CityEngine, can be extracted from LiDAR data, and some 3D data has been made available on open data portals. A first step to visualize this type of data is to publish a scene service, add it to a map as a scene layer, and then visualize it in a scene view. You can display the data either with the original textures or set a renderer to display the buildings with a different color or with a data-driven styling.
Feature Layer
Feature layer seems to be just a underlaying 3D scene. You have to publish it to a server for it to work on ESRI, for example This Swizarland 3D Map
This seems to be layers you call from a url?
A Scene layer which let you drop a 3D model on map!
Gold! I come accross this example that let you drag and drop a 3D model.
const mesh = await sceneLayer.convertMesh([file]);
  sketchVM.place(mesh, {
    graphicProperties: {
      layer: sketchLayer,
    }
  });
await sceneLayer.applyEdits({
addFeatures: graphics
});
await sceneLayer.applyEdits({
updateFeatures: graphics
});
await sceneLayer.applyEdits({
deleteFeatures: ids
});Add a custom feature with FeatureLayer
Accroding to the documentation you can create feature layer with either URL, arcgis id, or an array (feature layer table).
geometryType: If working with spatial layers, the geometry type of the features must be indicated (since only one geometry type is allowed per layer)- Both spatial and non-spatial feature collections require an objectId field, this must be indicated along with an array of field objects
You have to specify schema by use this structure:
{
    fields: [
        {name: "column", alias: "", type: "oid/string/date"},
        ...
    ],
    objectIdField: "column",
    geometryType:"point/null",
    spatialReference: { wkid: 4326 },
}
A client-side non-spatial table can be created by setting the layer’s geometryType property to null, then the table must be loaded by calling the load() method.
Implement in javascript
// Create an empty non-spatial feature layer
// Set geometryType property to null when creating non-spatial feature layer
const layer = new FeatureLayer({
  source: [],
  objectIdField: "OBJECTID",
  fields: [{
    name: "OBJECTID",
    type: "oid"
  }],
  geometryType: null
});
layer.load().then(() => console.log(layer.isTable))
Finally
// This is the working example
// Access ESRI module and place a custom event into a folder

import Map from "@arcgis/core/Map.js";
import SceneView from "@arcgis/core/views/SceneView";
import ElevationLayer from "@arcgis/core/layers/ElevationLayer";
import TileLayer from "@arcgis/core/layers/TileLayer";
import Graphic from "@arcgis/core/Graphic";
import ObjectSymbol3DLayer from "@arcgis/core/symbols/ObjectSymbol3DLayer";
import GraphicsLayer from "@arcgis/core/layers/GraphicsLayer"

import PointSymbol3D from "@arcgis/core/symbols/PointSymbol3D";

import Point from "@arcgis/core/geometry/Point.js"
import SimpleMarkerSymbol from "@arcgis/core/symbols/SimpleMarkerSymbol.js"

const marsElevation = new ElevationLayer({
    url: "https://astro.arcgis.com/arcgis/rest/services/OnMars/MDEM200M/ImageServer",
    copyright: "NASA, ESA, HRSC, Goddard Space Flight Center, USGS Astrogeology Science Center, Esri"
});

const marsImagery = new TileLayer({
    url: "https://astro.arcgis.com/arcgis/rest/services/OnMars/MDIM/MapServer",
    title: "Imagery",
    copyright: "USGS Astrogeology Science Center, NASA, JPL, Esri"
});


const map = new Map({
    ground: {
      layers: [marsElevation]
    },
    layers: [marsImagery]
  });

const view = new SceneView({
    map: map,
    container: "viewDiv",
    // setting the spatial reference for Mars_2000 coordinate system
    spatialReference: {
        wkid: 104971
    },
    camera: {
        position: {
        x: 27.63423,
        y: -6.34466,
        // z: 1281525.766,
        z: 128152.5766 * 6,
        spatialReference: 104971
        },
        heading: 332.28,
        tilt: 37.12
    }
});

// To import any 3D geometry, you have to create a new object called
// ObjectSymbol3DLayer
const buildingGeometry = new ObjectSymbol3DLayer({
    anchor: "relative",
    resource: {
      href: "/model 2/building-parts/individuals.glb" // Replace with the actual path to your .glb file
    },
    heading: 180, // Optional: Adjust rotation
    tilt: 0,
    roll: 0,
    depth: 750000,   // Adjust scale as needed
    width: 750000,
    height: 10000
  });

// Essentailly We Are Using This ObjectSymbol as one singular Symbol;
const buildingSymbol = new PointSymbol3D({
    symbolLayers: [buildingGeometry]
});

// Define the graphic with the symbol and add to the layer
// Point Graphical Network;
const pointGraphic = new Graphic({
    geometry: {
        type: "point",
        x: 27.63423,
        y: -6.34466,
        spatialReference: {
            wkid: 104971 // this is Mars wkid
        }
    },
    symbol: buildingSymbol
});

const graphicsLayer = new GraphicsLayer();
graphicsLayer.add(pointGraphic);
map.add(graphicsLayer);
in INDEX.html:
<link rel="stylesheet" href="https://js.arcgis.com/4.32/esri/themes/light/main.css">
<style>
    html,
    body,
    #viewDiv {
        padding: 0;
        margin: 0;
        height: 100%;
        width: 100%;
    }
</style>
<body>
    <script type="module" src="a1-esri-mars.js"></script>
    <style>
        /* html,
        body,    */
        #viewDiv {
          padding: 0;
          margin: 0;
          height: 100%;
          width: 100%;
        }
    </style>
    <div id="viewDiv"></div>
</body>