# A tibble: 50 × 7
   rank_from rank_to  decade          n rank_from_int rank_to_int movement
   <chr>     <chr>    <chr>       <int>         <int>       <int> <chr>
 1 Top 1000  Top 1000 after_2010   1870          1000        1000 no-movement
 2 Top 1000  Top 1000 before_2010   237          1000        1000 no-movement
 3 Top 500   Top 100  after_2010    106           500         100 up-ranking
 4 Top 200   Top 1000 after_2010    112           200        1000 down-ranking
 5 Top 100   Top 100  after_2010    518           100         100 no-movement
 6 Top 500   Top 500  before_2010   240           500         500 no-movement
 7 Top 500   Top 500  after_2010   2054           500         500 no-movement
 8 Top 100   Top 500  before_2010    18           100         500 down-ranking
 9 Top 100   Top 500  after_2010    110           100         500 down-ranking
10 Top 200   Top 500  after_2010    149           200         500 down-ranking
# ℹ 40 more rowsResearcher Graph
vis_graph = function(g, title) {
  ggraph(g, layout = 'kk', weights = 1/n) +
  geom_edge_fan(
    aes(width = n, label = n, color = movement)
    , arrow = arrow(type="open")
    , alpha = 0.25
    , position = "jitter"
    , n = 100
  ) +
  geom_node_label(aes(label = name), color = "white", fill = "black") +
  theme_void() +
  coord_equal() +
  ggtitle(title) +
  scale_edge_color_manual(values = c("up-ranking" = "#48c9b0", "down-ranking" = "#a93226", "no-movement" = "#95a5a6")) +
  scale_edge_width(range = c(0.1,3.5)) +
  theme( legend.position = "none" )
}vis_graph(g1, "Before 2010")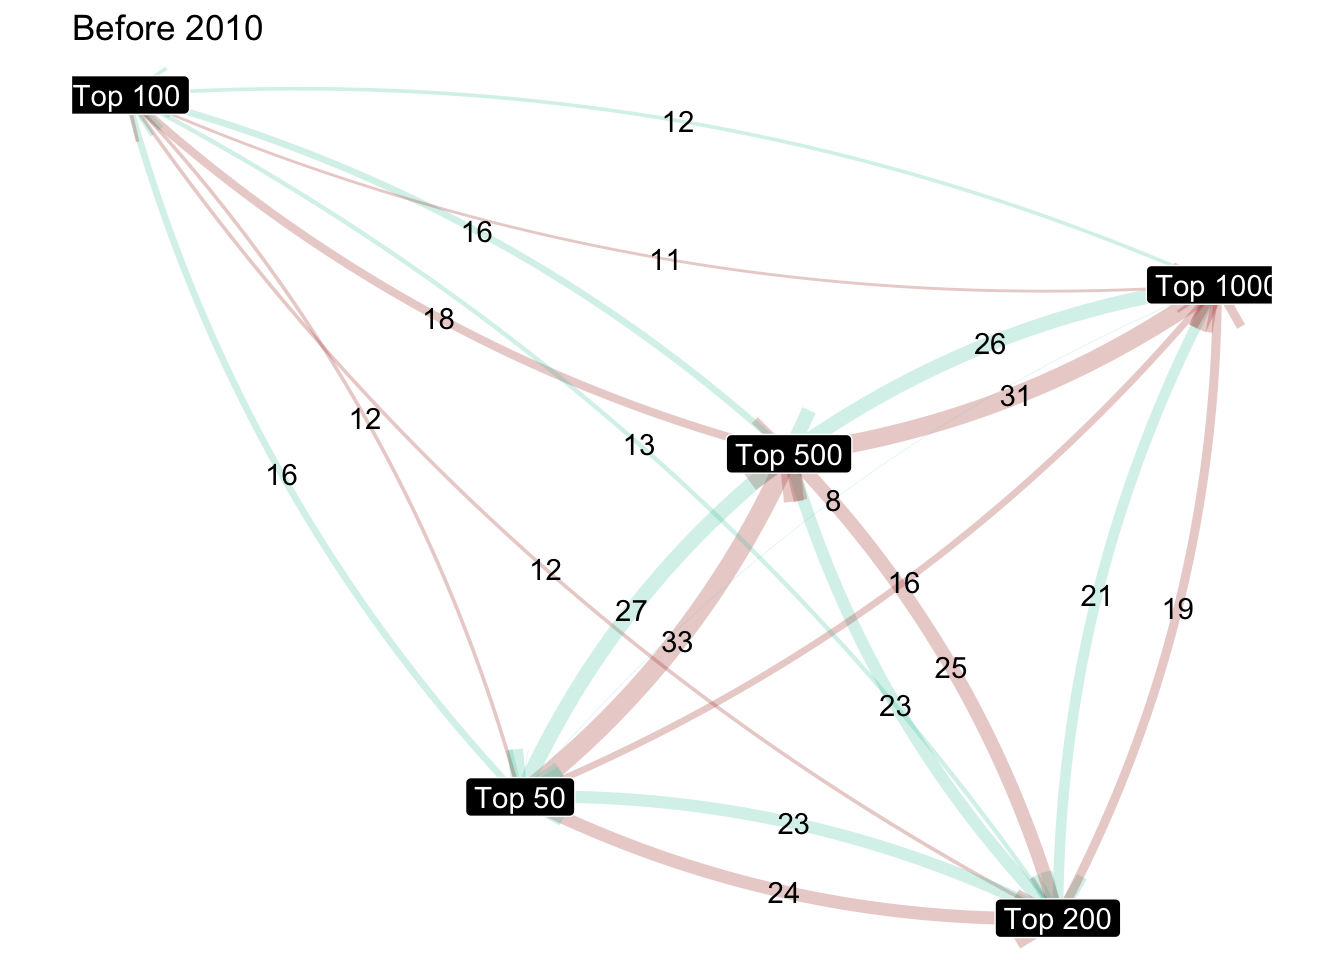
vis_graph(g2, "After 2010")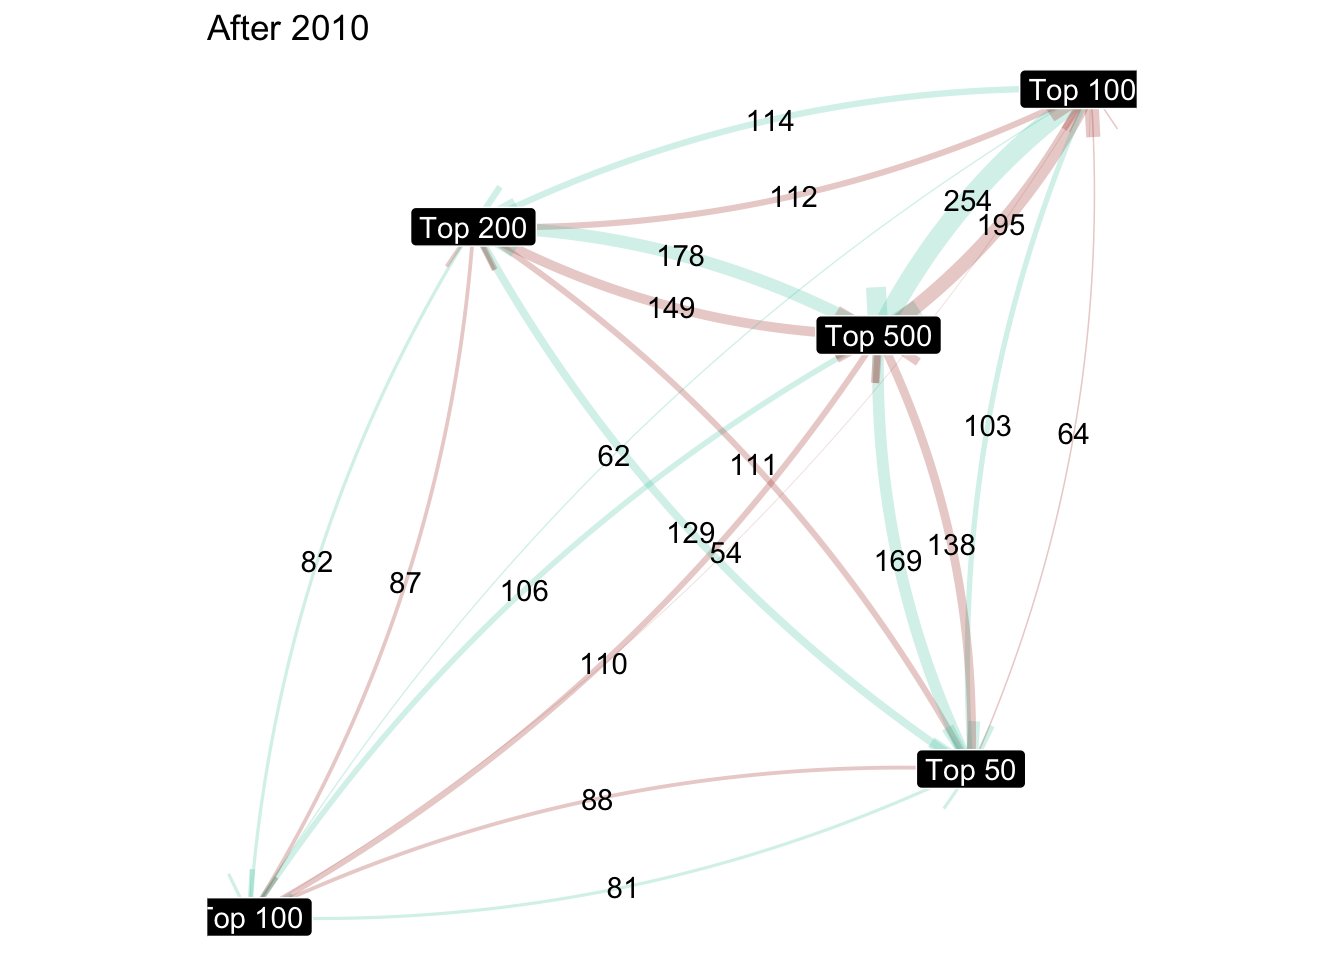
Interestingly more exchanges between Top 500 and others… this is most likely because the bracket of top 500 are way to large rather than any actual underlaying reason.